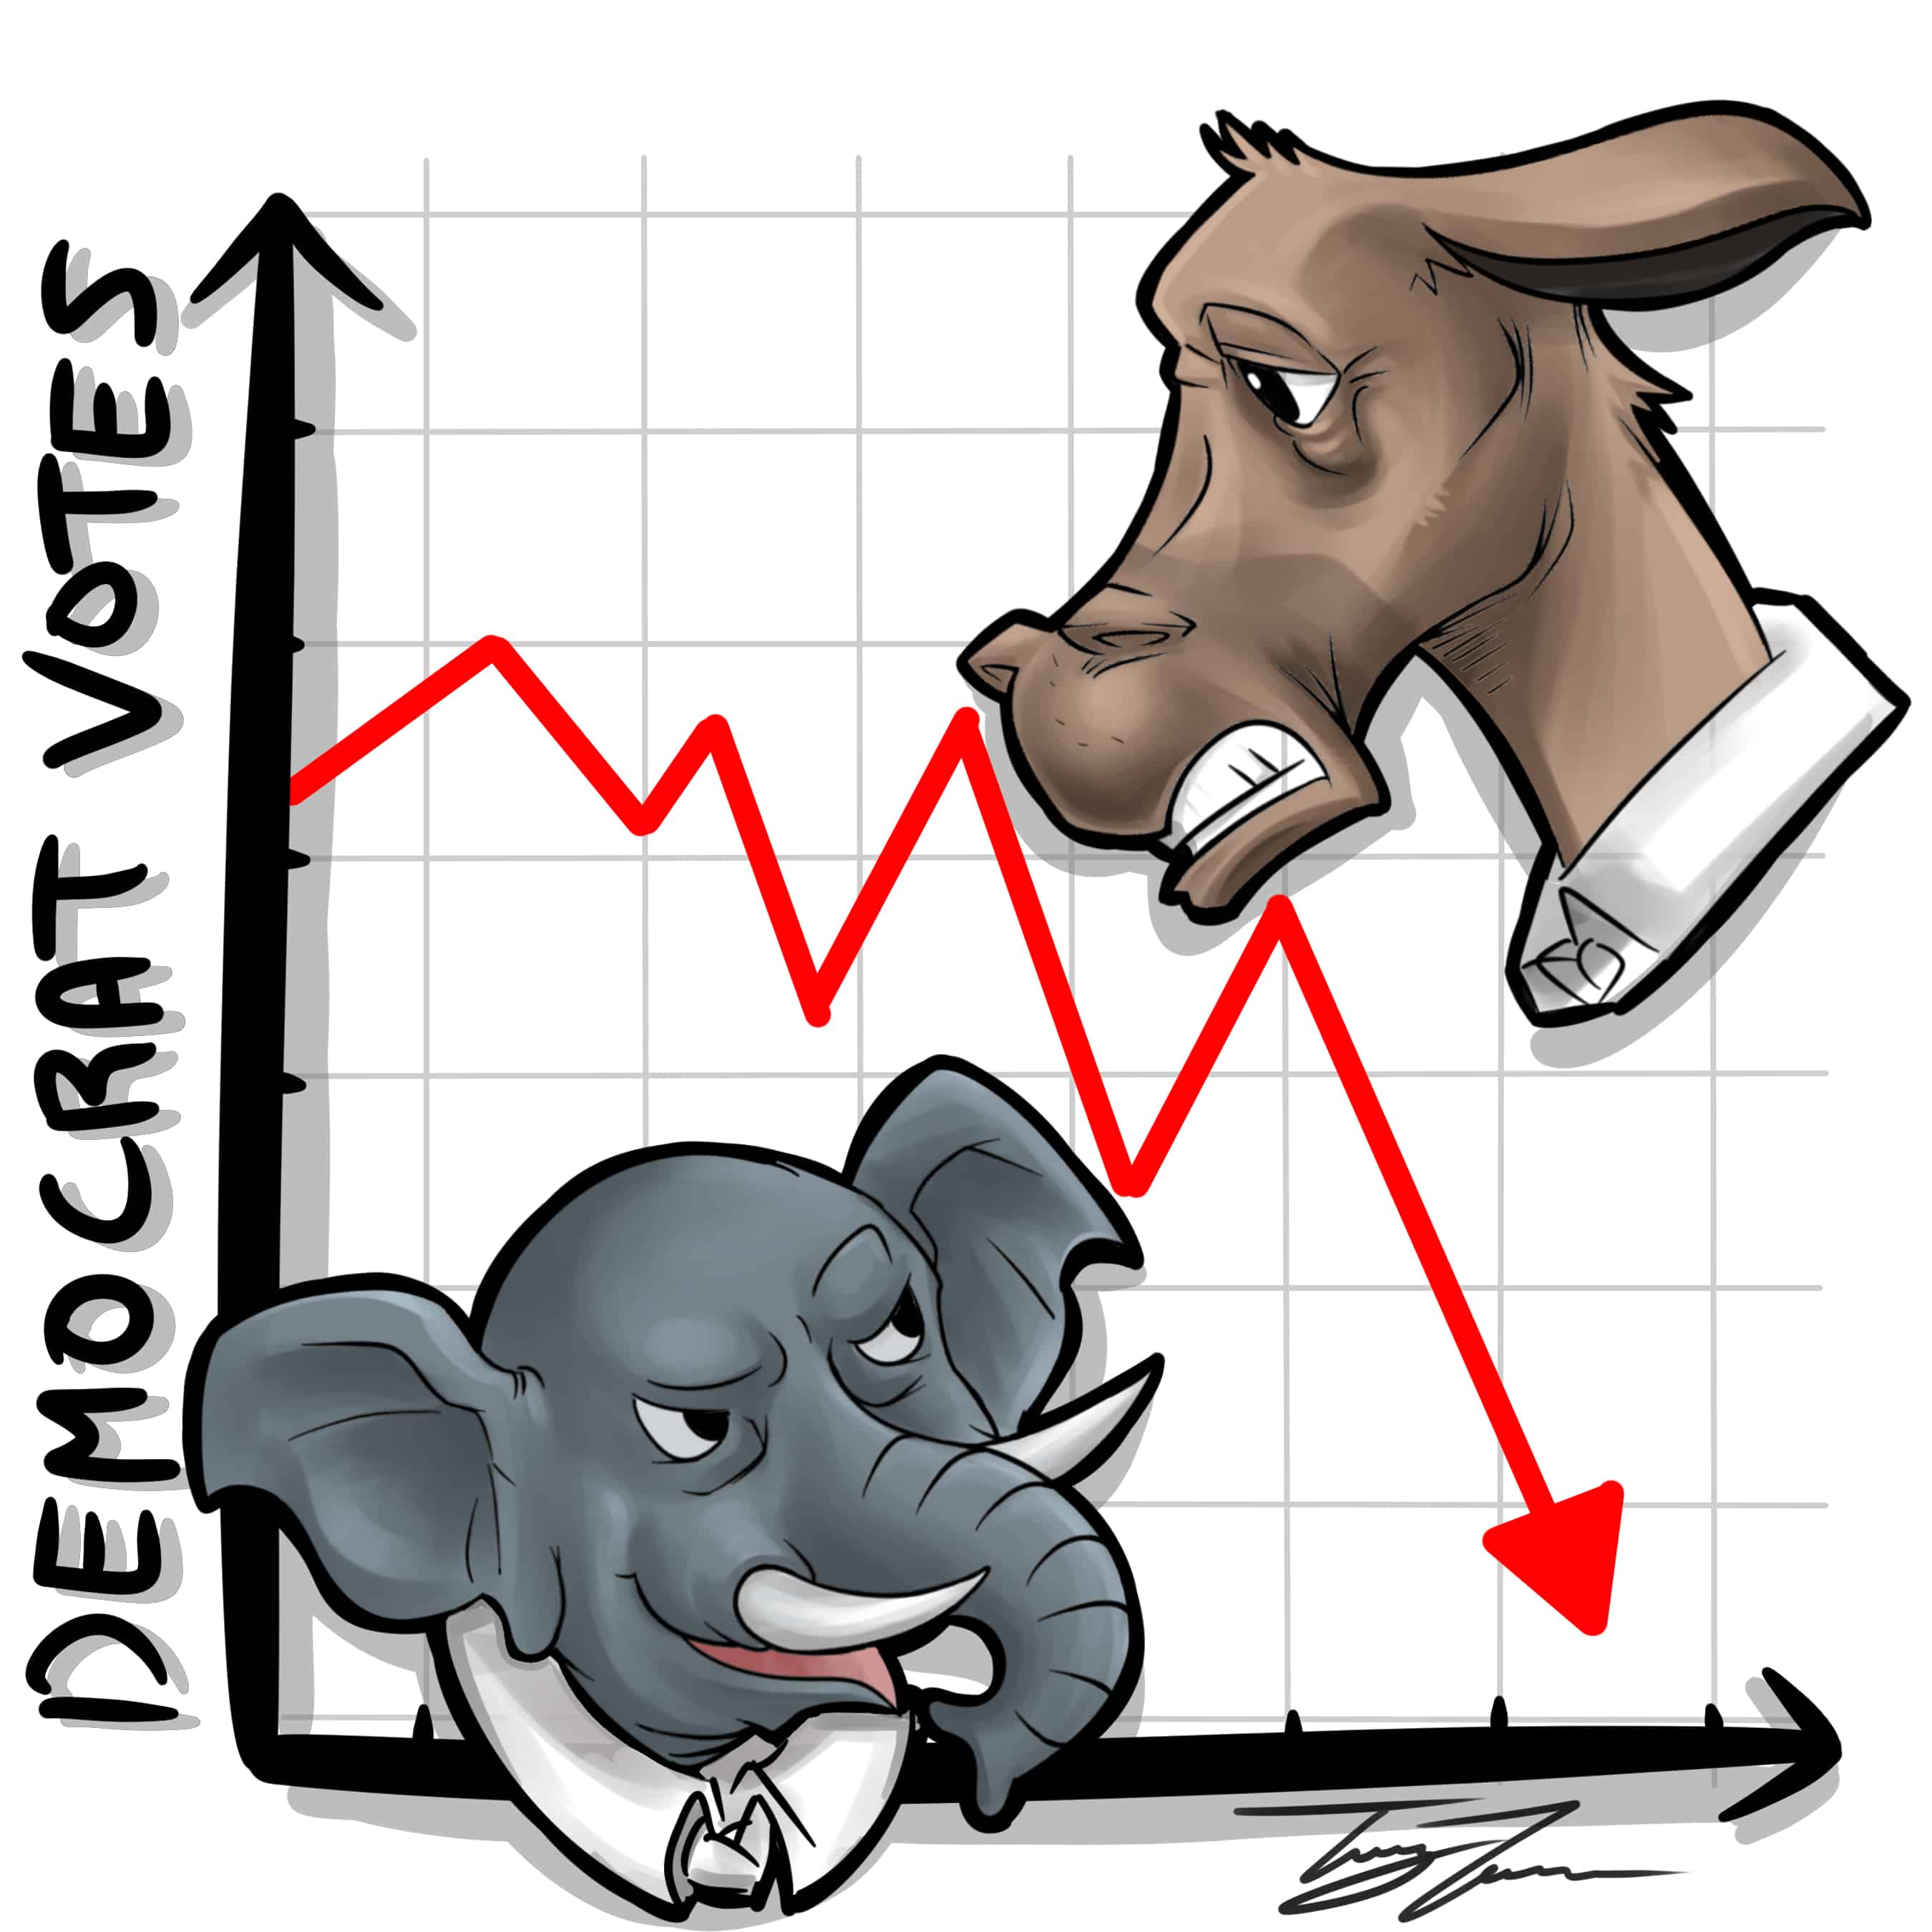
On November 8, 2016, at 7:00 pm EST, those glued to their TVs or phone screens harboured the expectation that Hillary Clinton had an 85 per cent chance of becoming the next American president. Three hours later — agonizing for some and joyous for others — President-elect Donald Trump had picked up Florida and Ohio, the latter of which has predicted every president since 1964.
Clinton’s chance of winning plummeted quickly. There were many questions on our minds, but one stood out more than the rest: how did this happen, given that some polls had predicted not just a victory for Clinton but a sizeable one at that?
To begin, many of them think that a late shift favouring Trump occurred on Election Day. Polls on November 8 showed a 3 per cent lead for Trump, whereas the day before, poll aggregator Real Clear Politics showed a 3 per cent lead for Clinton.
The other issue that could have led to a polling inaccuracy is what is referred to as ‘sampling bias.’ When selecting the sample size for a poll, two methods can be used: quota sampling and random sampling. Sampling bias can occur with each method.
Quota sampling is often used in online polls, whereby agencies attempt to replicate the demographic makeup of the electorate. The problem with this approach is that people without access to the Internet may not get to participate in such polls, leading to inaccuracies.
Random sampling, which uses probability statistics to select a random, robust representation of the electorate, is considered more accurate than quota sampling. However, random sampling is usually conducted by phone, and its accuracy is a function of response rates, which can be lower than 10 per cent.
Another possible reason is the fact that polling agencies tend to ‘herd’ together. If a polling agency produces a significantly different result from its competitors, it might adjust the weights of the polling average to get a value in line with other polls, which may be mistakenly assumed by pollsters as more accurate.
There have been agencies, however, that have consistently maintained a polling average favouring Trump, like the LA Times poll.
Further discrepancies may have arisen on the end of poll respondents. In some cases, respondents who preferred the controversial Trump may have altered their answers. This may not have been the case for the many Trump supporters who were quite vociferous in their support, but it may have played a role among minority groups whom Trump insulted, as they may have been reluctant to vocalize their support for Trump.
A conflation of these factors led to drastic polling errors, combined with the fact that the demographic of non college-educated whites was largely unaccounted for by pollsters.
It should also be noted that social media likely played a more significant role in this election than in any previous one in the US. Online echo-chambers form are communities where people thrive in ideological herds and have no exposure to opposing perspectives. During the ‘Brexit’ referendum, in which citizens of United Kingdom voted on whether or not to remain within the European Union, the ‘Remain’ supporters were confident in their side’s victory, and they were surprised when the ‘Leave’ side came out ahead. Most people would agree that social media echo-chambers had a major role in the shock of Trump’s victory.
It is probable that a series of erroneous assumptions accumulated throughout the course of the election campaign. While data scientists were left reeling after the election, any combination of the above reasons can possibly be the reason why they got it wrong.


